
Australia is known for its stinking hot summers…but what about its winters? While Australian winters may not be the coldest in the world, they can still bring chilly temperatures and frosty mornings. Many homes aren’t built for the cold, prompting Aussies to rely heavily on air conditioners and central gas heating for heating.
We wanted to identify the LGAs where people experience the chilliest winters, based on seven different factors: latitude, elevation, temperature, humidity, wind, daily solar exposure, tree canopy, and average heating costs. We weighted the scores and then gave each LGA a ranking out of 100; the higher the score, the colder the area is.

It’s no surprise that Hobart tops the list as Australia’s chilliest city. The city’s southern latitude and low elevation of 19m contribute to an average temperature of 8.94°C, along with a relatively low absolute moisture content (5.03g/kg). This chilly climate and environmental factors make Hobart a less appealing option for those who aren’t fond of the cold.
Close behind is the Australian Capital Territory (ACT), where a much higher elevation of 606m results in the lowest average temperature recorded (6.8°C). Although heating costs are slightly higher than Tasmania ($236 vs $207 respectively), the area benefits from low moisture content (4.90g/kg) and strong solar exposure (10.13 MJ/m²) during winter, helping to balance out the cold.
The remainder of the top ten is dominated by Victoria, with Kingston, Maroondah and Knox all scoring above 87/100. These suburbs enjoy a blend of consistent tree cover, moderate elevation and affordable heating costs ($189). While their average temperatures hover around the 10°C mark, small differences in wind speed, solar exposure and canopy coverage subtly affect overall comfort.

For those chasing the warmest winters in Australia, Darwin and nearby Palmerston sit firmly at the bottom of the chilliness rankings, scoring just 0.00 and 0.58 out of 100, respectively. With average winter temperatures nearing 25°C and high levels of humidity (11.16g/kg), these Northern Territory cities enjoy year-round warmth and virtually no need for heating. Further south, Brisbane ranks as the third least chilly city, with mild winter days averaging nearly 15°C, though slightly higher heating costs and reduced solar exposure take the edge off its score.
Western Australia dominates the rest of the list, with Fremantle, East Fremantle, Cottesloe, and Mosman Park all featuring. These coastal suburbs benefit from steady sea breezes (5.10m/s), and generous winter sunshine (11.21 MJ/m²). Rounding out the list are Mandurah, Joondalup, and Cockburn, reinforcing the trend that Western Australia’s coastal fringe offers some of the most temperate winters in the country. Overall, the least chilly cities are overwhelmingly tropical or coastal, where geography, ocean winds, and abundant sunshine combine to deliver warm, comfortable winters with minimal reliance on heating.


“Our study reveals that while location plays a major role in how cold and ‘chilly’ a city is, the Australian winter isn’t quite so straightforward. Factors such as wind, elevation, latitude and lack of sunlight can all contribute to how cold a city feels. Wind, for instance, can significantly enhance the perception of cold through wind chill, making temperatures feel much lower than they actually are.
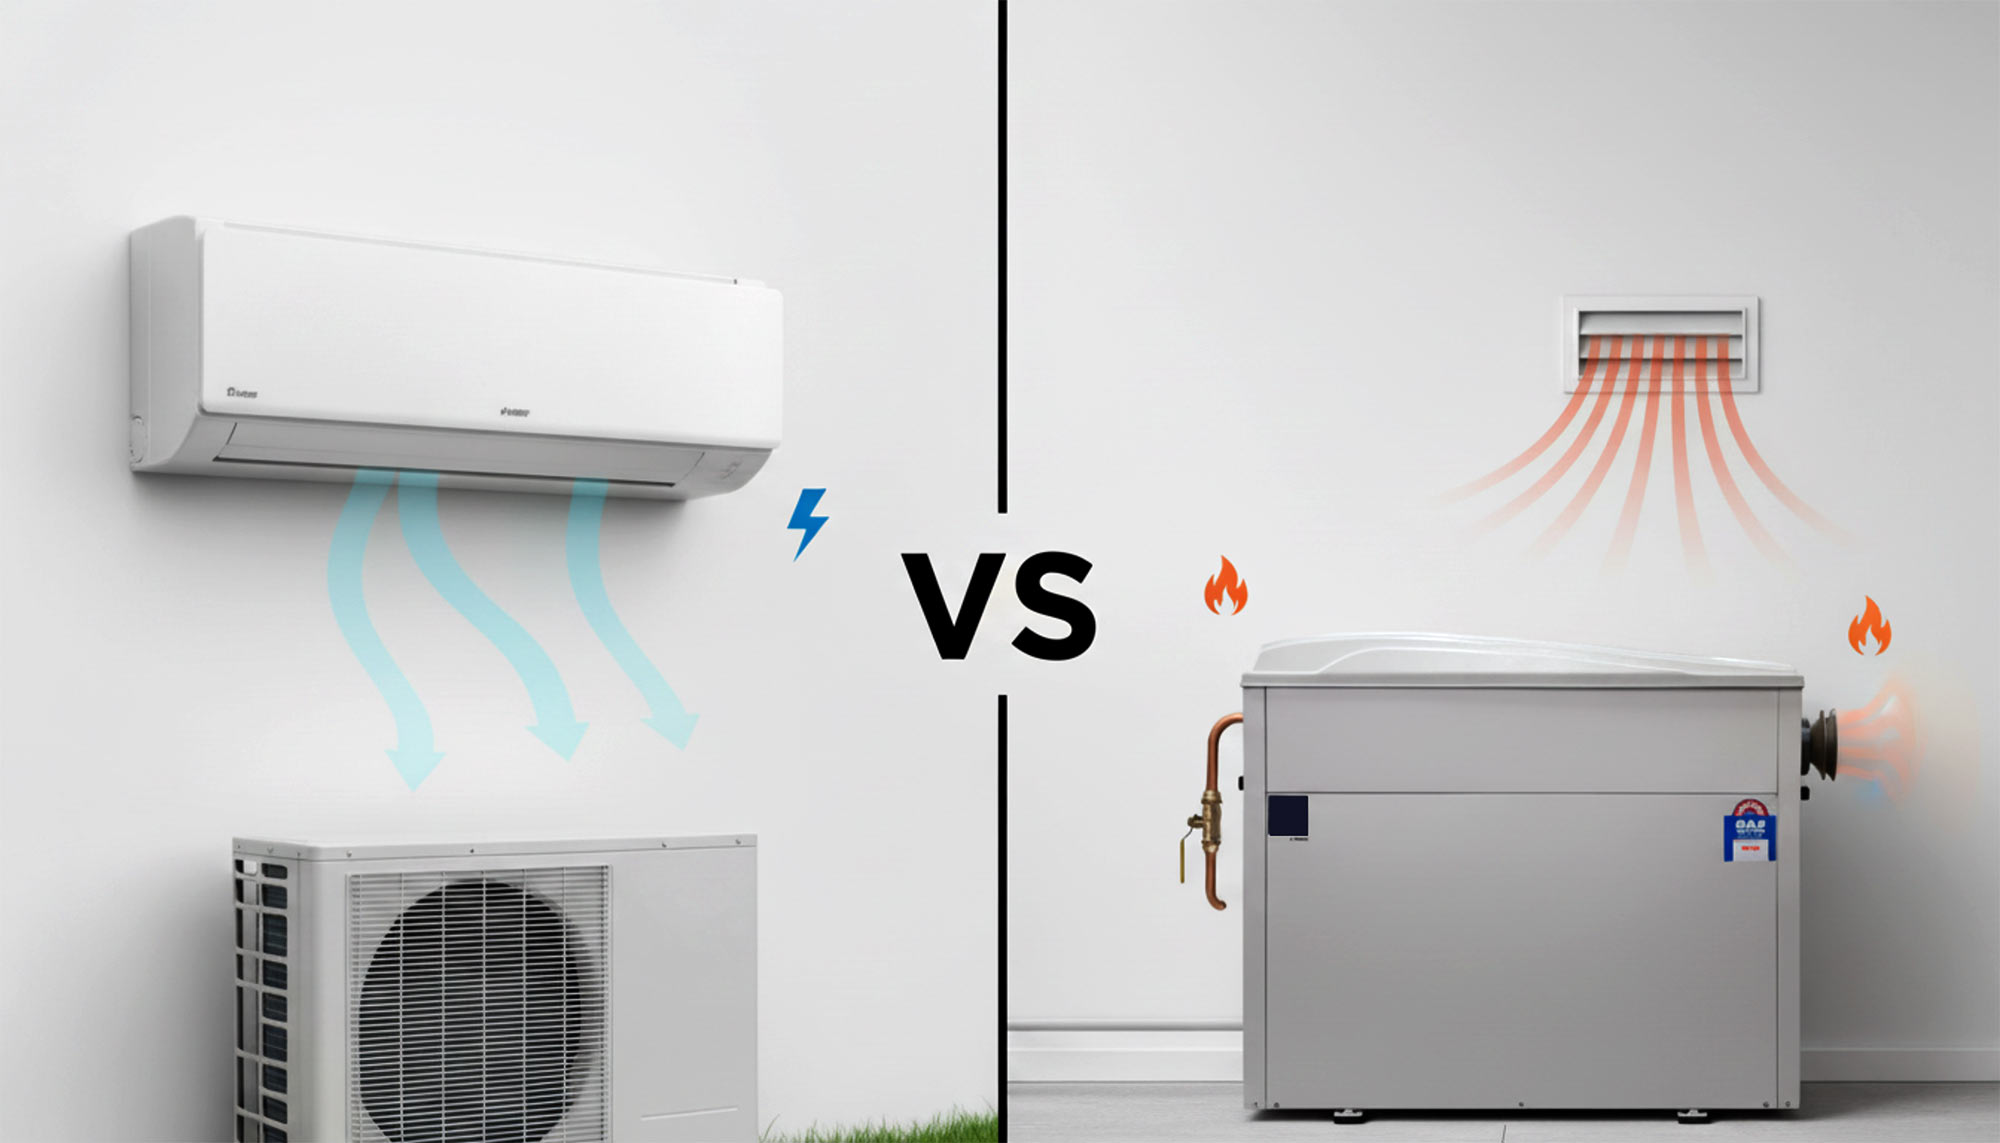
“Our research also highlights the rising cost of heating due to the increasing cost of living. Australians should consider investing in energy-efficient heating systems, such as reverse-cycle air conditioners or high-efficiency gas heaters, as these can make a substantial difference in long-term costs. Similarly, setting heaters to an economical temperature (18-20°C) and regular maintenance ensures a comfortable environment without overworking the system.”
We ranked the 100 most densely populated Local Government Areas (LGAs)** in Australia to analyse where the chilliest places in the country are using 7 key metrics that either contribute to that often uncomfortable winter chill or help to ease the level of biting frost. These are listed below with their corresponding weights. The metrics were combined to create a 100-point scale, with a score of 100 representing the maximum level of chilliness.
To objectively identify Australia’s chilliest cities, we developed a data-driven Chilliness Score using Principal Component Analysis, to uncover underlying patterns in multivariable datasets. This approach allowed us to synthesise multiple environmental and climatic factors into a single, interpretable index score. The weighting for each factor was based on the absolute value of each PCA weight normalised to add up to 100%.
Population Density data is sourced from the Australian Bureau of Statistics’ Regional Population for the 2023-24 financial year.
Temperature, humidity and wind averages for LGAs are based on the data for their corresponding climate zone according to the Australian Government Department of Climate Change, Energy, the Environment and Water (DCCEEW), accessed via the Nationwide House Energy Rating Scheme (NatHERS) Climate Zone Map. Some LGAs are split between two climate zones, in which case, the zone that covers the majority of the LGA is allocated.
All daily solar exposure data from the Bureau of Meteorology (BoM) comes from 2015 – 2024 except for Sydney Observatory, which ranges from 2018 -2024. LGAs that are linked to multiple BoM stations use an average solar exposure from these stations.
Latitude data has been sourced from Geocode by Awesome Table API based on the location of each LGA, and from this, elevation data has been sourced from the Open Elevation API based on the exact LGA coordinates.
Australia’s Environment Report Card 2024 from the Australian National University and Terrestrial Ecosystem Research Network was utilised for the tree canopy percentage of each LGA.
Average Winter Heating Costs data was sourced from Finder. This study used running costs of 70 electric heaters during winter months, categorised by Australian states and territories.
The information on this page is intended as a general guide or indicator only and should not be taken as constituting professional advice.
* June to August inclusive.
** Peppermint Grove, despite being one of the most densely populated LGAs, was excluded from the analysis due to insufficient or statistically insignificant data availability.
*** This study presents the 99 most densely populated LGAs (excluding Peppermint Grove), along with the Unincorporated ACT—ranked 128th overall—but included to ensure representation of the ACT region.